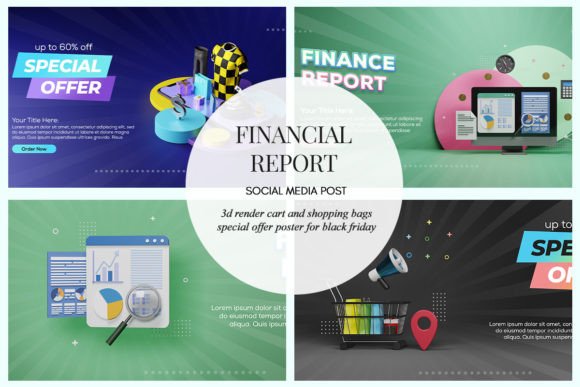
3D Rendering Financial Report: A Modern Tool for Visual Storytelling in Business
In the fast-paced world of business, communication is key. Whether you're presenting to investors, designing a marketing campaign, or building a compelling website landing page, clarity and impact matter more than ever. Enter the 3D rendering financial report — a powerful visual tool that helps professionals convey complex financial data with simplicity and style. This post explores how this innovative approach can be used across industries, why it's gaining traction, and what you should know before jumping on board.
What Is a 3D Rendering Financial Report?
A 3D rendering financial report uses three-dimensional visuals to represent financial data and insights. Unlike traditional reports filled with dense text and basic charts, these reports leverage modern design techniques and 3D modeling to create engaging, easy-to-digest content. They often include elements like floating graphs, layered infographics, and stylized icons to highlight numbers, trends, and performance metrics in an intuitive way.
These reports are typically created using tools like Photoshop, Illustrator, or specialized 3D software, and then exported into formats such as PSD or JPG for use in presentations, websites, social media, and other digital platforms. The beauty lies in their flexibility — they’re editable, customizable, and designed to fit seamlessly into your brand’s aesthetic.
Real-World Use Cases for 3D Rendering Financial Reports
Let’s dive into some practical scenarios where a 3D rendering financial report can make a difference:
- Investor Presentations: When pitching to potential investors, you want to stand out. A clean, minimalistic 3D layout can turn a standard PowerPoint slide into a visually striking story. Highlighting growth projections with floating bar charts or revenue streams through animated 3D flow diagrams can leave a lasting impression.
- Websites and Landing Pages: If you're running a fintech startup or a consulting firm, your landing page needs to communicate value quickly. Using 3D rendered financial visuals allows you to showcase performance stats without overwhelming your audience. Think of a hero section with a sleek 3D graph showing market share increase over time — it speaks louder than words.
- App Interfaces: Mobile apps that deal with personal finance, stock tracking, or budgeting benefit from interactive 3D elements. Imagine a user opening an app and seeing their monthly expenses represented by floating 3D cubes, each color-coded for different categories. It’s not just informative — it’s immersive.
- Social Media Campaigns: With the rise of short-form content, businesses are looking for ways to present information quickly. A 3D rendering financial report post can be adapted into eye-catching Instagram or LinkedIn graphics. These posts are perfect for sharing quarterly results, ROI breakdowns, or cost-saving success stories in a format that stops the scroll.
- Internal Reporting: Teams need to understand financial health at a glance. A 3D report can help break down departmental budgets, project timelines, or sales forecasts into digestible components. Minimalist 3D objects like spheres or lines can show progress toward goals in a way that feels modern and less cluttered.
Who Can Benefit from Using 3D Rendered Financial Content?
While the 3D rendering financial report may sound niche, its applications are broad. Here’s who can get the most out of it:
- Financial Analysts: These professionals often work with large datasets. Converting those numbers into 3D visualizations makes patterns easier to spot and simplifies explanations for non-experts.
- Marketing Teams: For campaigns targeting high-net-worth individuals or corporate clients, a polished 3D financial graphic can elevate your message. It adds a layer of professionalism and innovation that sets your content apart.
- Product Designers: If you’re creating SaaS products or mobile apps, integrating 3D financial visuals into your UI/UX design can enhance user experience. It offers a fresh take on how users interact with financial data.
- Entrepreneurs and Startups: You don’t need a big budget to make a strong visual statement. Affordable and ready-to-edit 3D templates allow startups to create professional-looking reports and marketing materials quickly.
- Consultants and Advisors: Delivering client proposals or performance reviews becomes more effective when paired with dynamic 3D visuals. It shows you’re up-to-date with design trends and committed to clear communication.
Strengths of a 3D Rendering Financial Report
The appeal of 3D financial reports goes beyond aesthetics. Here are some of the key strengths:
- Visual Clarity: Data is processed faster when presented visually. 3D elements help reduce cognitive load by making abstract concepts tangible.
- Brand Consistency: With editable fonts, colors, and sizes, you can tailor the design to match your brand identity. This ensures your message remains cohesive across all channels.
- Engagement Boost: Static reports can feel dry. Adding subtle depth and dimension through 3D renders grabs attention and keeps viewers interested longer.
- Flexibility Across Platforms: From PDF documents to social media ads, a well-designed 3D financial report adapts easily. Its modular nature means you can reuse parts of it for different audiences or purposes.
- Modern Appeal: In a digital-first world, using cutting-edge visuals signals that your business is forward-thinking. It’s not just about looking good — it’s about standing out.
Considerations Before Using 3D Rendered Financial Reports
Before you go full 3D, here are a few things to keep in mind:
Clarity Over Complexity: While 3D designs can be stunning, they shouldn’t distract from the core message. Ensure that the visuals serve the data and don’t become a gimmick. Less is often more when it comes to financial reporting.
Accessibility: Not everyone views 3D content the same way. Consider how different devices and screen sizes will render your visuals. Also, provide alternative text descriptions for accessibility compliance.
Tool Compatibility: Make sure the file formats (like PSD or JPG) you choose are compatible with your existing workflow. Some tools might require additional plugins or conversions to work effectively.
Time and Skill Investment: Creating original 3D content from scratch demands time and technical expertise. Fortunately, many designers now offer pre-made templates that balance quality and ease of use. Just click and edit — no need to master 3D software.
Industries That Are Embracing 3D Financial Reporting
Several industries have already adopted 3D rendering for financial storytelling:
- Finance and Banking: Used in dashboards and client-facing summaries to visualize investment portfolios or loan performance.
- Technology and SaaS: Companies showcase usage statistics, customer growth, and revenue models with 3D elements to emphasize scalability and innovation.
- Real Estate: Developers and agents use 3D visuals to demonstrate projected returns on property investments or market trends.
- Healthcare and Pharmaceuticals: Organizations track R&D costs, clinical trial outcomes, and funding allocations using 3D graphs to simplify complex processes.
- E-commerce and Retail: Brands analyze sales data, inventory turnover, and customer acquisition costs with minimalistic 3D objects that add flair without confusion.
Practical Examples of 3D Financial Reporting
To better understand the value of a 3D rendering financial report, consider these real-life examples:
Example 1: A fintech company wants to explain how its platform reduced operational costs by 40%. Instead of listing percentages, they use a rotating 3D ring chart with transparent layers showing before-and-after comparisons. The result? A clearer picture and a stronger call to action.
Example 2: An e-learning platform is launching a new course on financial literacy. Their social media ad features a minimalist 3D graph illustrating average income growth after completing the course. The ad gets 50% more engagement compared to previous static versions.
Example 3: A real estate developer presents a quarterly update to stakeholders using a 3D map with floating icons representing property values and construction milestones. The presentation earns praise for being both informative and visually appealing.
Special Offer: 3D Rendering Post for Social Media Advertising
If you’re looking to enhance your next project with minimalistic 3D objects, there’s a great opportunity to streamline the process. Our special offer includes a professionally designed 3D rendering financial report post that’s perfect for social media advertising. Here’s what you get:
- 100 Editable Elements — Easily tweak text, fonts, and sizes to suit your brand.
- Click-and-Edit Functionality — No advanced design skills needed. Just open the file and adjust as needed.
- PSD and JPG Formats — Compatible with most design tools and platforms.
- High-Quality 3D Objects — Designed to look sharp and modern on any screen.
- 4 File Adjustments Included — Get support to customize the template further if required.
This package is ideal for marketers, business owners, and designers who want to integrate 3D visuals into their financial storytelling but lack the time or resources to build them from scratch. It’s a plug-and-play solution that brings creativity and clarity together in one place.
Why Minimalism Works in 3D Financial Design
Minimalism isn’t just a design trend — it’s a mindset. When applied to 3D financial reports, it helps avoid visual overload and keeps the focus on the message. Simple shapes, clean lines, and limited color palettes make it easier for the audience to grasp key points quickly.
For instance, using a single floating 3D sphere to represent total revenue, with smaller spheres orbiting around it for expenses, profits, and losses, can give a clear overview without complexity. Or a line-based 3D structure that traces the path of funds from acquisition to distribution. These approaches are not only stylish but also functional.
Getting Started with Your Own 3D Financial Report
You don’t need to be a designer to start using 3D financial visuals. Many online platforms offer templates that cater to different industries and use cases. Look for options that let you change fonts, colors, and dimensions effortlessly — especially if you plan to reuse the assets for various projects.
When choosing a 3D rendering financial report post, consider the following:
- Does it align with your brand identity?
- Can you modify it for different audiences or platforms?
- Is the design clean enough to remain effective even when viewed on small screens?
- Are the 3D elements scalable and responsive?
Once you’ve selected a template, test it in real-world settings. See how it performs in meetings, on your website, or in social media ads. Gather feedback and refine the design to maximize its effectiveness.
Final Thoughts on 3D Financial Reporting
The 3D rendering financial report is more than just a design upgrade — it’s a strategic tool for better communication. By transforming numbers into visuals, you open the door to deeper understanding and engagement. Whether you’re preparing for a pitch, updating your website, or planning a social media campaign, the right 3D visuals can tell your story with precision and personality.
Take advantage of our special offer today and see how a well-crafted 3D financial report can bring your next project to life. With just a few clicks, you can unlock a new level of creativity and clarity that resonates with your audience — and drives results.